This week I learned of a new variant that is resistant to any previous immunity, but those who are vaccinated experienced diminished or no symptoms. That seems to be the trend we’ve seen in the past months. It’s still spreading, but people are not seeing severe illness. So it seems best to keep up with your vaccinations when you are eligible. Only a couple more weeks of these updates unless my internet connection next weekend is lacking.
This weekly update of cases is showing that the national average of daily new cases has been fairly steady for the past 5 weeks. This week the 14-day average of daily new cases increased by 1.0% compared to a increase of 5.7% last week. It brings the national 2 week average up to 35.6 new cases per 100 000 people.

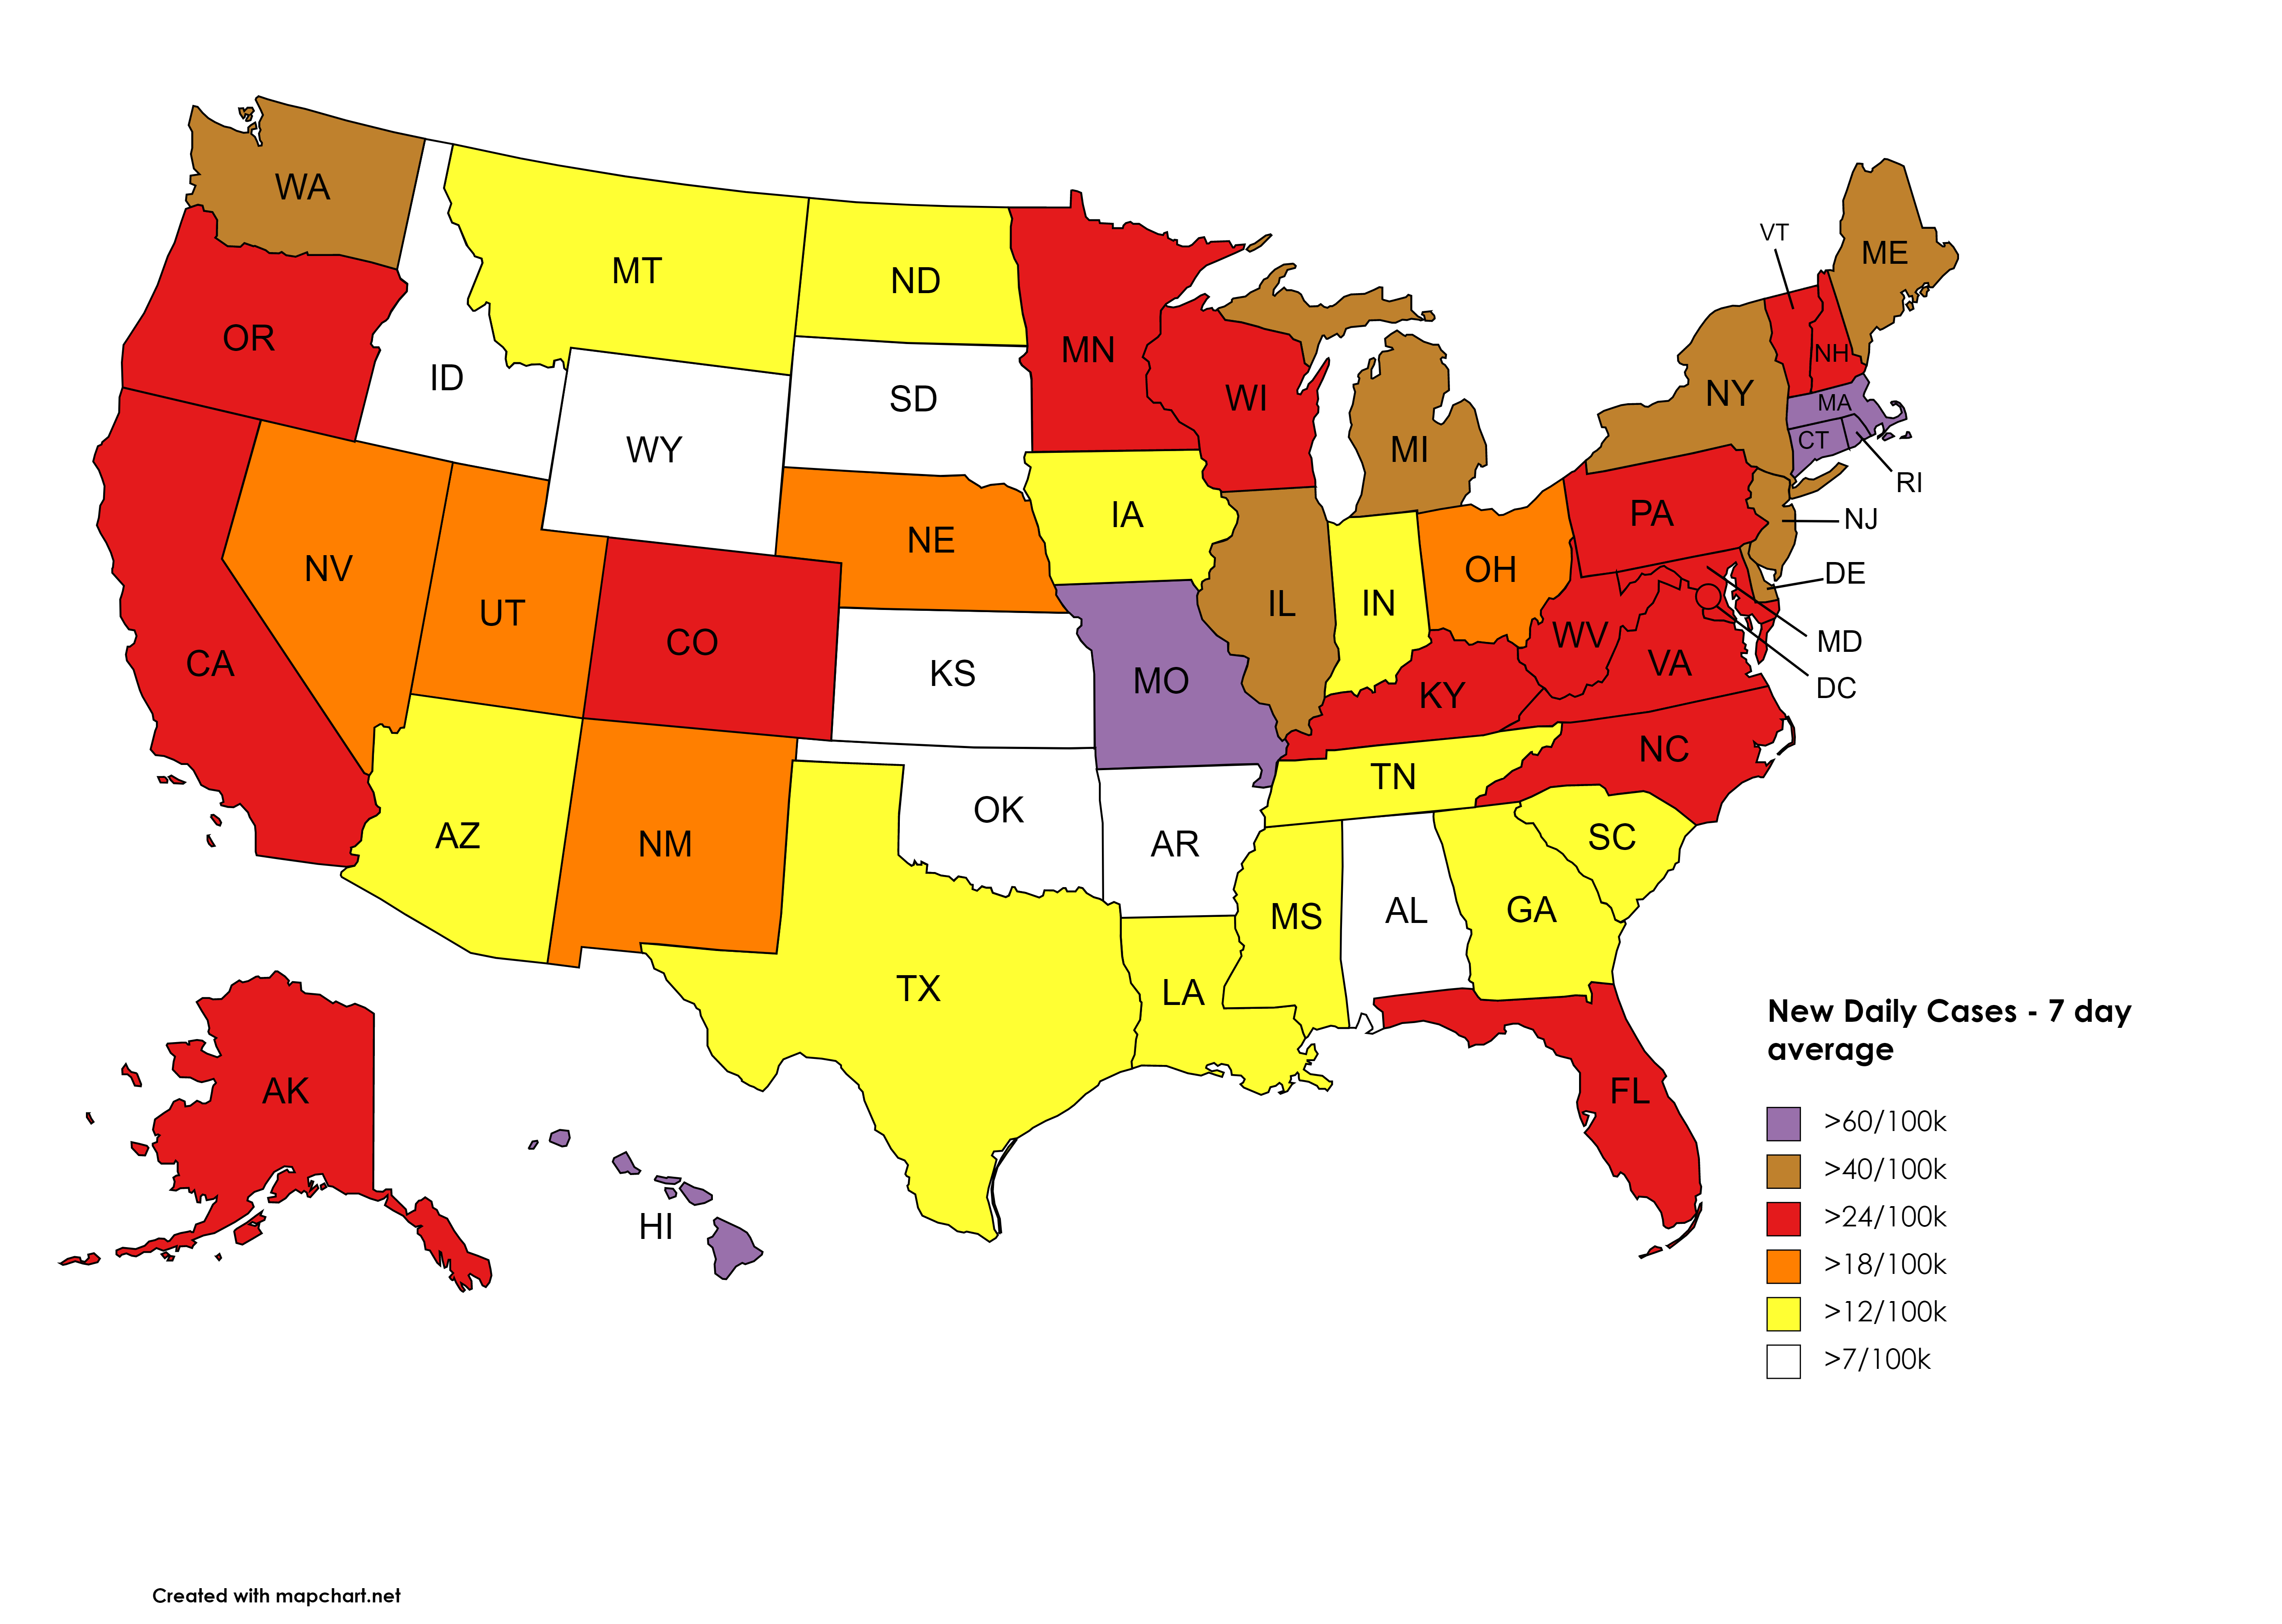
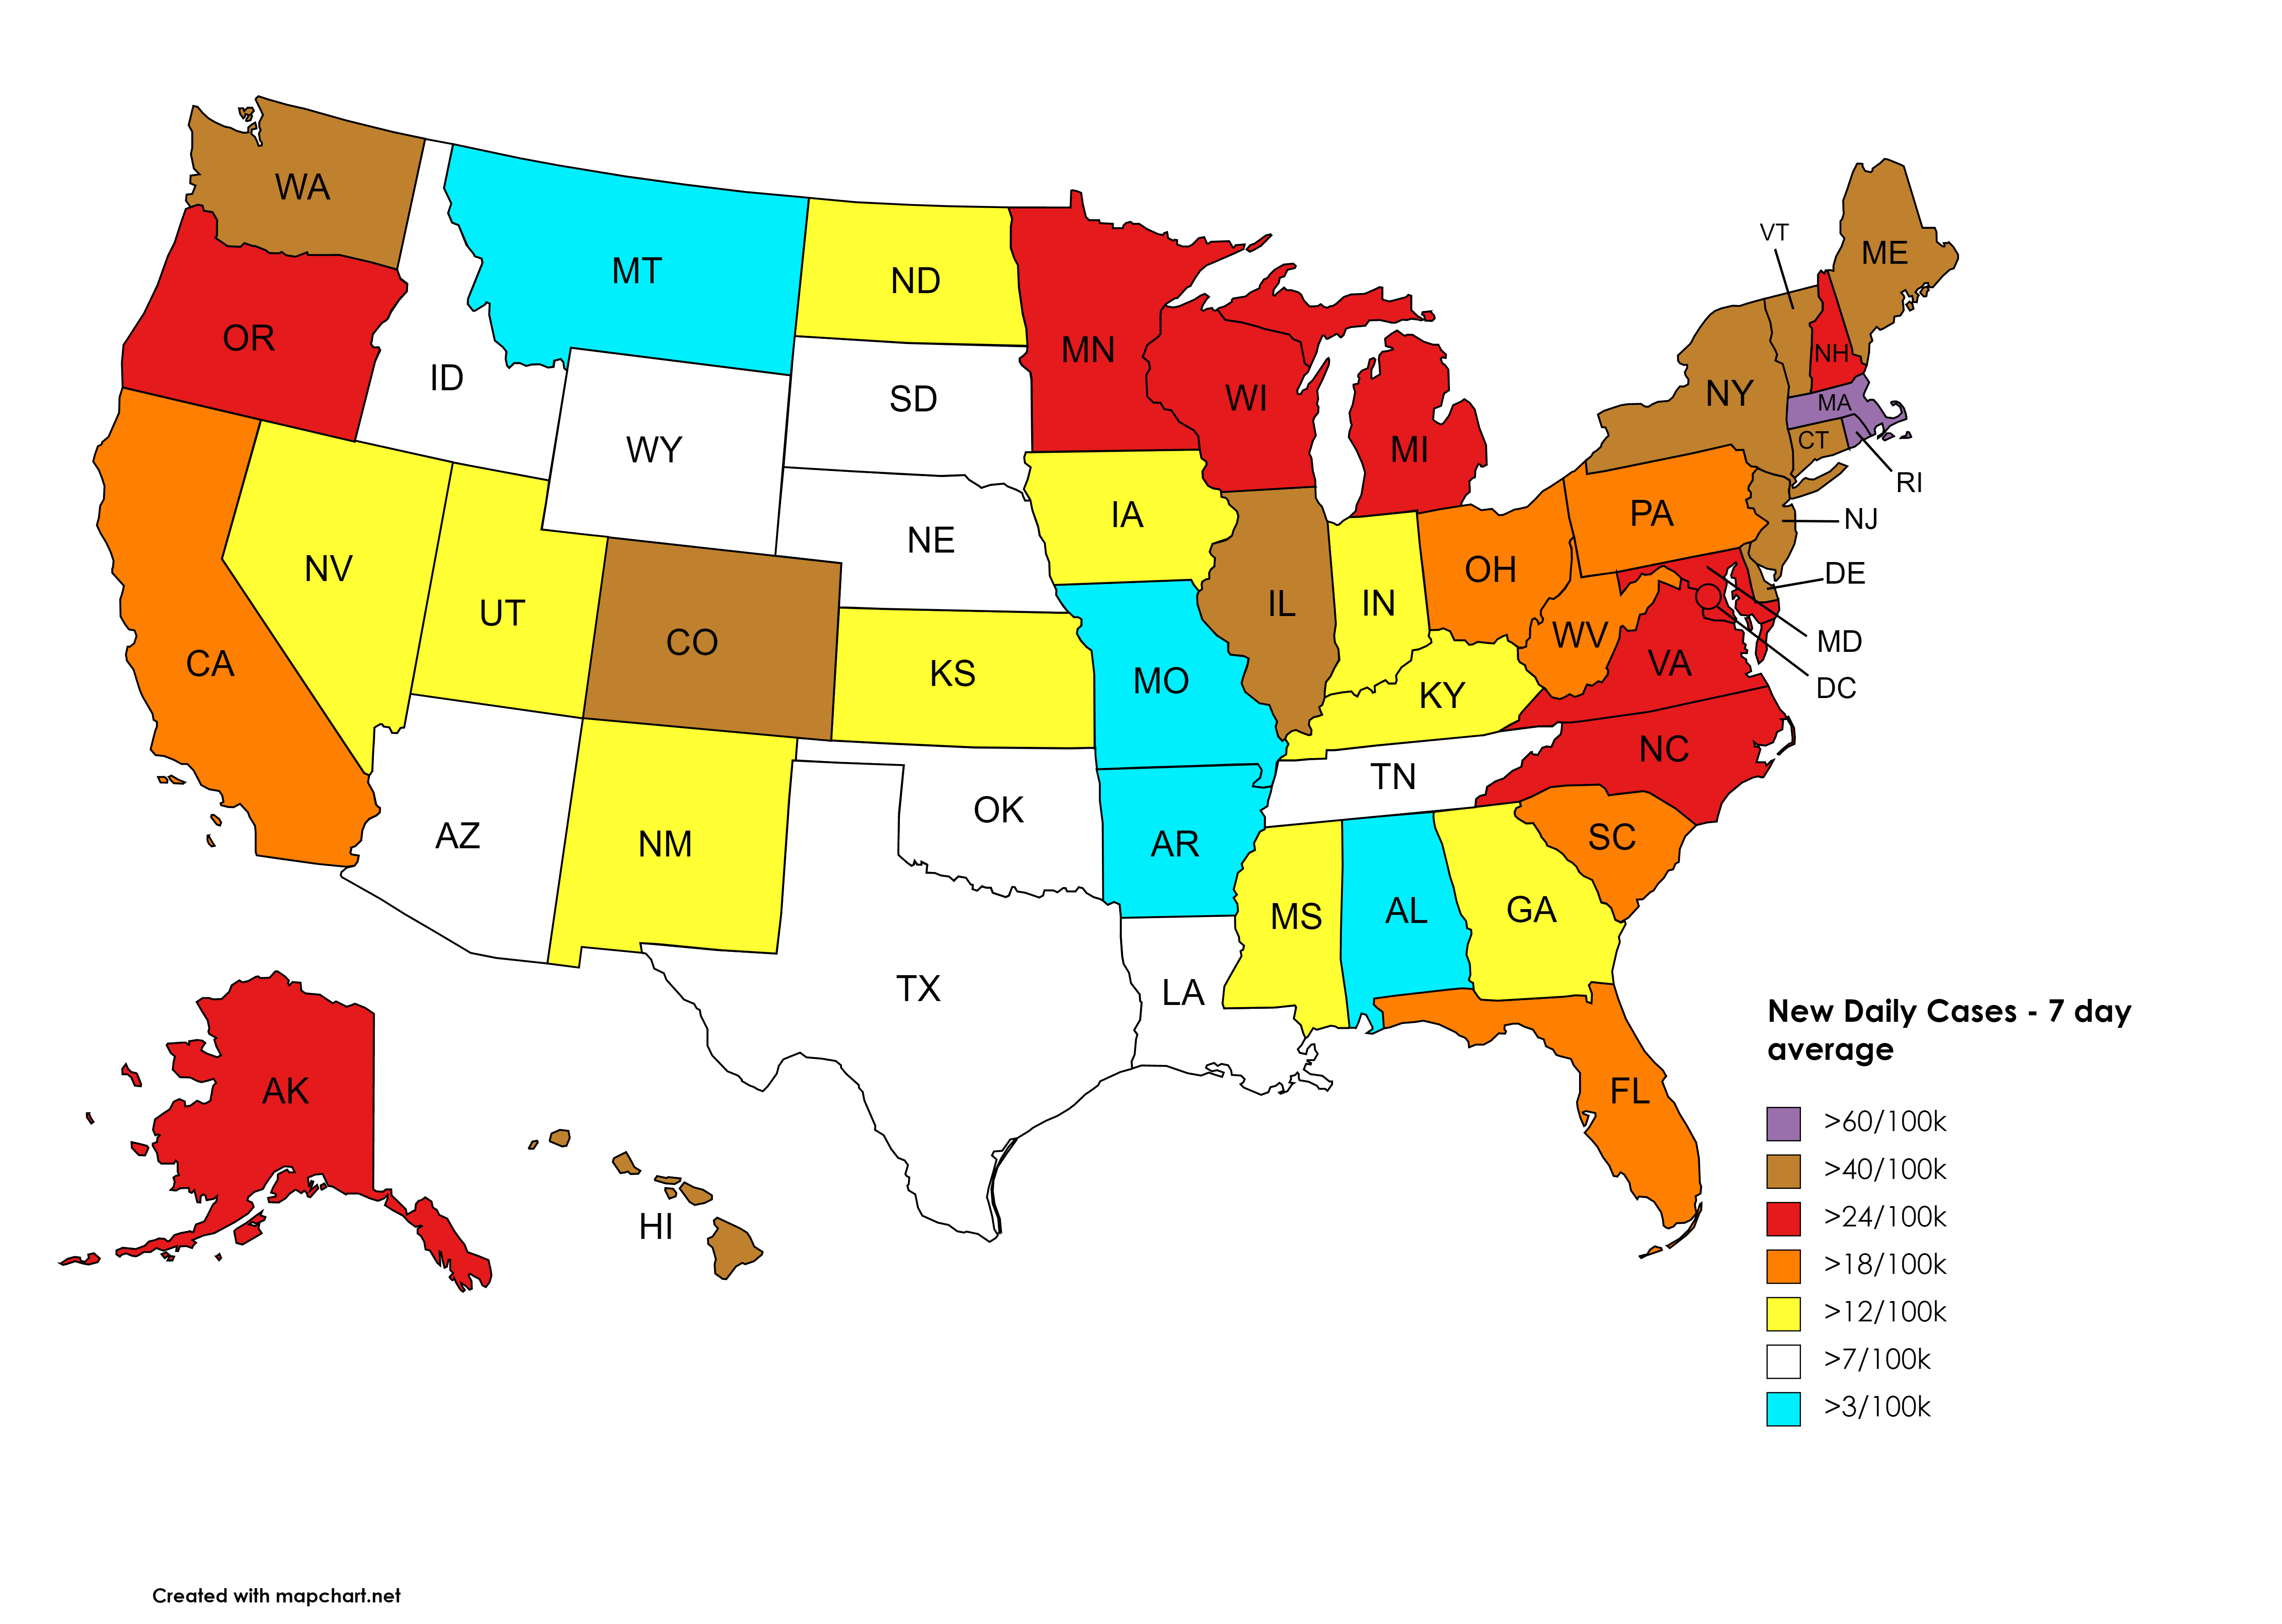
This first map shows the rate of new daily cases per 100 000 people. In my opinion, states have the spread of the virus under control if they can keep that down below 3/100k. There are no states below that level. The closest is Vermont at 10.9. There have been no states below 3/100k for ten weeks now. 35 states are above the 24/100k mark with Alaska the highest at 57/100k. There were 39 states above that mark last week.

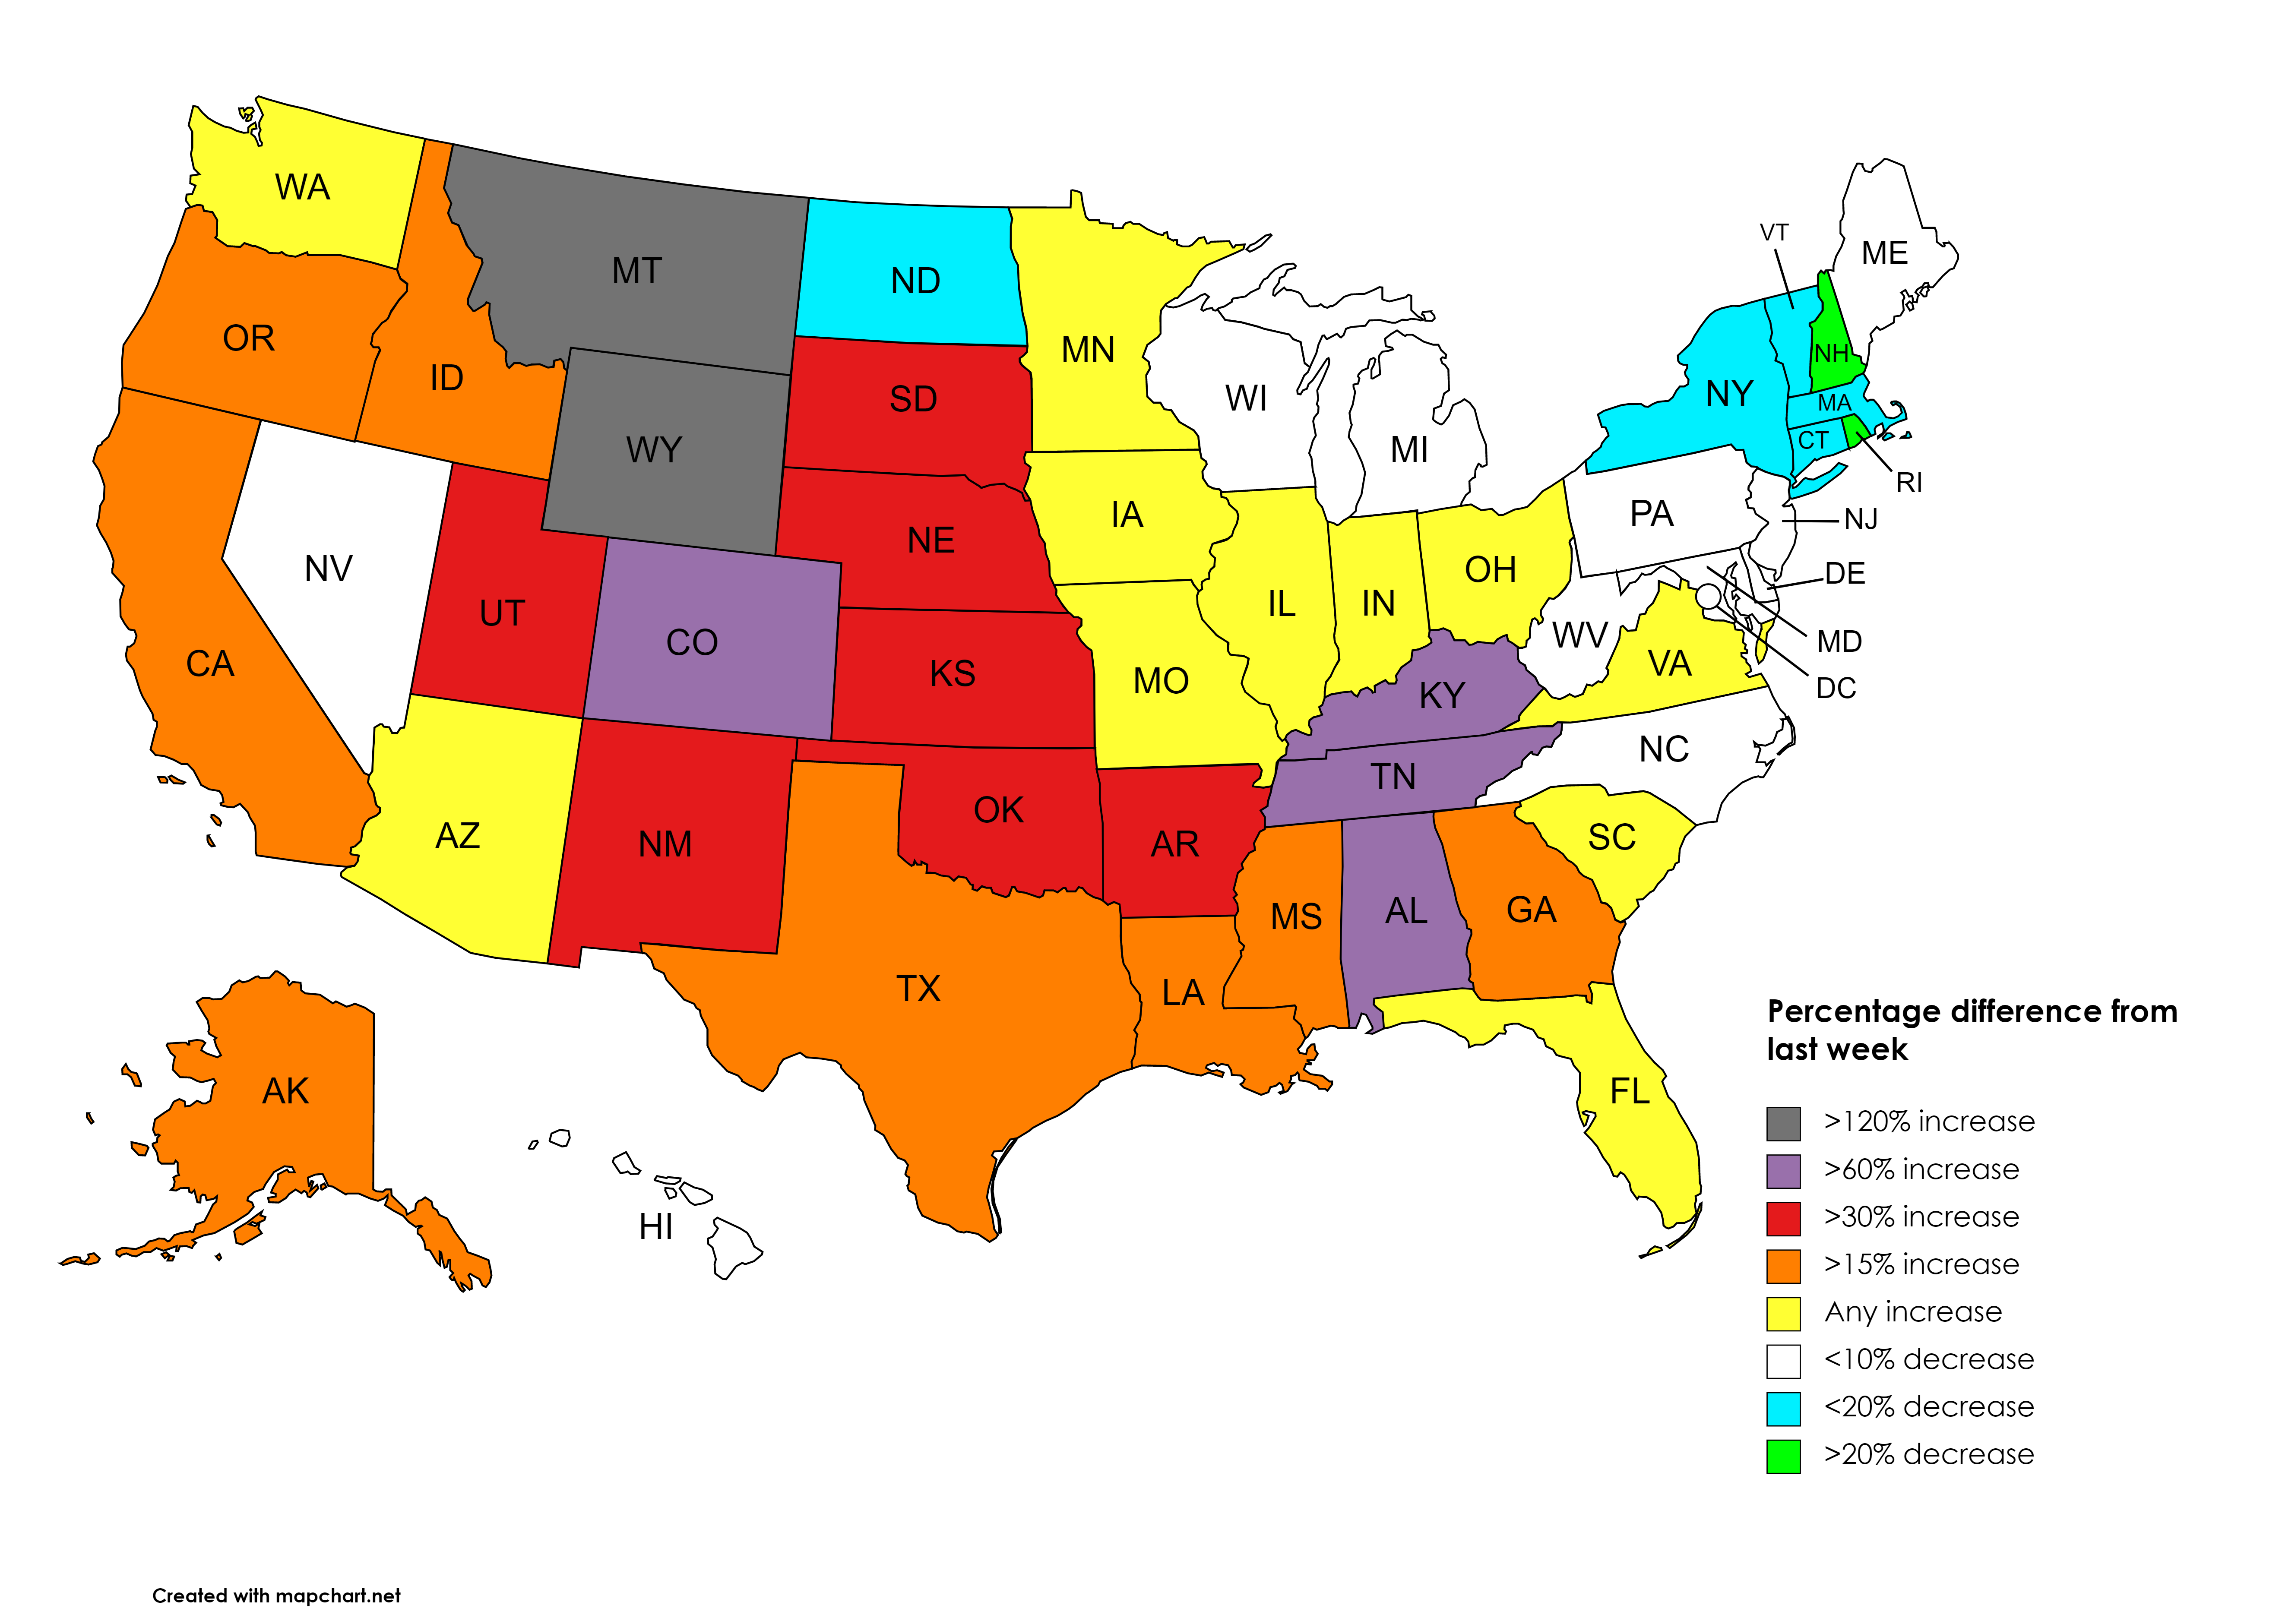
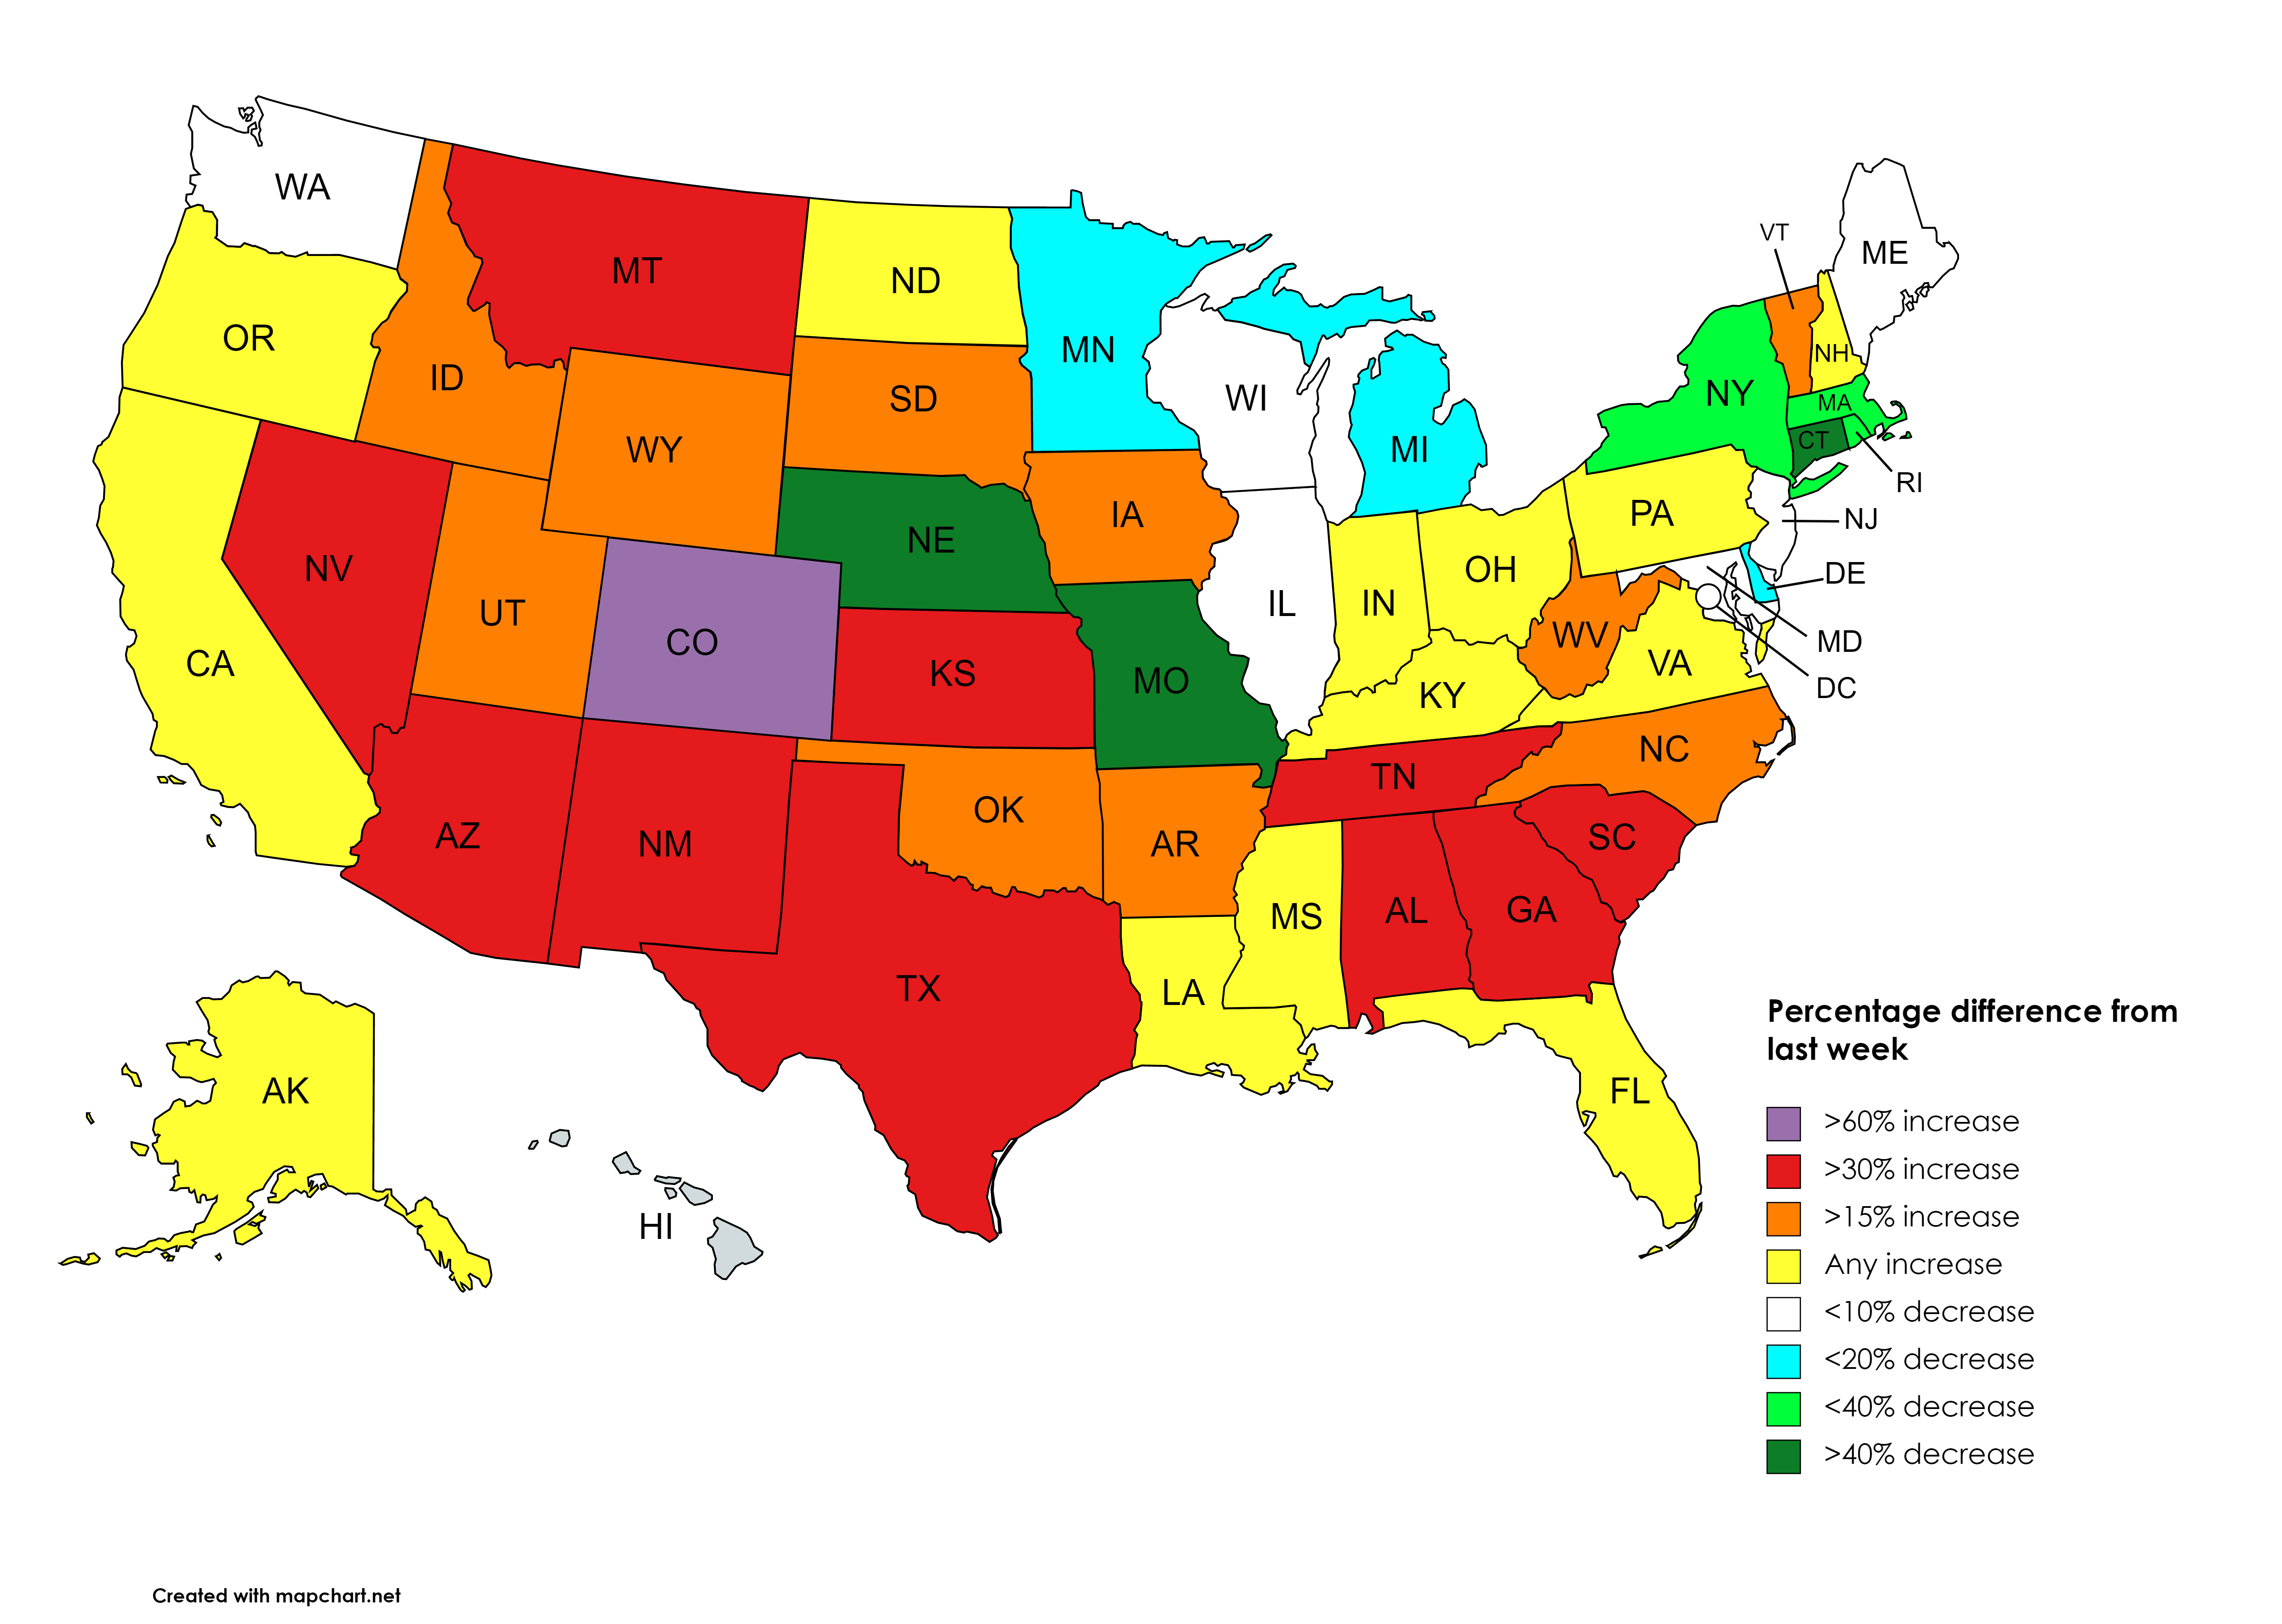
The second map shows the increase or decrease in the per capita rate of new cases over the past week compared to the week before. It is worth noting that this map only shows the difference from last week in order to highlight local surges or declines.
For the other places I’m tracking, here are the rates and percentages. I’ve been tracking the large cities and select countries for comparison. Those with rates lower than 3/100k, higher than 24/100k, or those with increases or decreases more than 20% have been put in bold :
Illinois: 31/100k, down 2%
Chicago: 25/100k, down 17%
New York City: 37/100k, stayed the same
Los Angeles county: 40/100k, down 23%
North Carolina: 35/100k, up 6%
Canada: 7.5/100k, up 11%
Ontario: 4.9/100k, down 12%
Waterloo region: 4.6/100k, down 17%
Quebec: 12.2/100k, up 22%
Montreal: 14.6/100k, up 22%
India: 1.22/100k, up 8%
Italy: 153/100k, up 53%
France: 193/100k, up 30%
Spain: 50/100k, up 14%
Iran: 1.38/100k, up 183%
South Korea: 31.1/100k, up 87%
China: <0.01/100k, up 193%